Multiscale Analysis of Fatigue Crack Growth
Jay Carroll, Christos Efstathiou, Prof. John Lambros, Prof. Huseyin Sehitoglu
In this work, we analyze the crack closure process using digital image correlation (DIC). Microscale measurements are made with DIC displacement gages (see Figure 1). These displacement gages allow us to plot crack opening displacement as a function of position along the crack line (see Figure 2) and measure crack closure levels. Macroscale measurements are made using full-field DIC. Figure 3 shows the vertical displacements around a crack tip. A least squares regression is performed on this data (See Figure 4) to calculate the effective stress intensity factor from displacements.
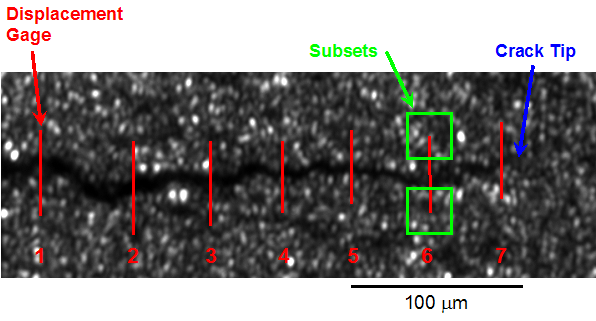
Figure 1. Illustration of seven DIC displacement gages across open crack faces imaged at 14x. Each gage consists of two subsets-one on each of the crack flanks.
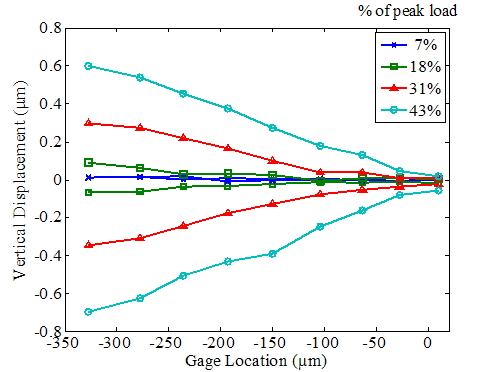
Figure 2. Crack profiles constructed from displacement gage measurements as a function of load for the low K experiment. 0 mm denotes the crack tip location. As expected, the single gage ahead of the crack tip never appears open.
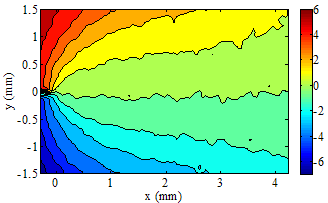
Figure 3. DIC measured v-displacement field near the crack tip for macroscale images. Rigid motion has been subtracted from these plots for clarity.
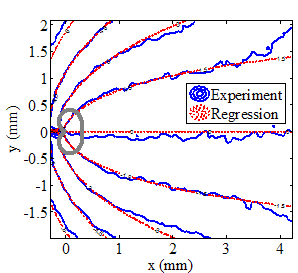
Figure 4. Comparison of experimentally measured and regression v-displacement contours (using a KT regression). The thick solid gray contour represents the approximate Von-Mises plastic zone size. Magnification is 1.1x and contours are spaced by 1.5 mm.